I wrote this in July 2018. At the time a lot of reporting still meant someone running the same query every morning and pasting the result into an email. I wanted to show how little it takes to hand that job to a script: one Python file, one cron entry, and a Mac that stays on.
The pipeline is deliberately plain. Some of the tooling has aged, and one habit from the original (passwords typed straight into the script) should not survive into anyone’s real setup. I have kept the structure, fixed the code, and marked where things have changed.
Why automate a report
Plenty of metrics get checked on a fixed rhythm. A manager wants week-over-week performance every Friday. Senior analysts want yesterday’s revenue first thing each morning. Whatever the report, if the question is the same every time, the answer can be produced without a person in the loop. All it needs is a small data pipeline.
Here I turn a standard Amazon Redshift query into an emailed report.
What you need
- An Amazon Redshift cluster (or any PostgreSQL-compatible database) with a table to query.
- An editor or IDE. In 2018 I used Spyder from Anaconda; VS Code works just as well.
- The Python packages
pandasandpsycopg2. - An email account that can send over SMTP. I used Gmail.
How the pipeline fits together
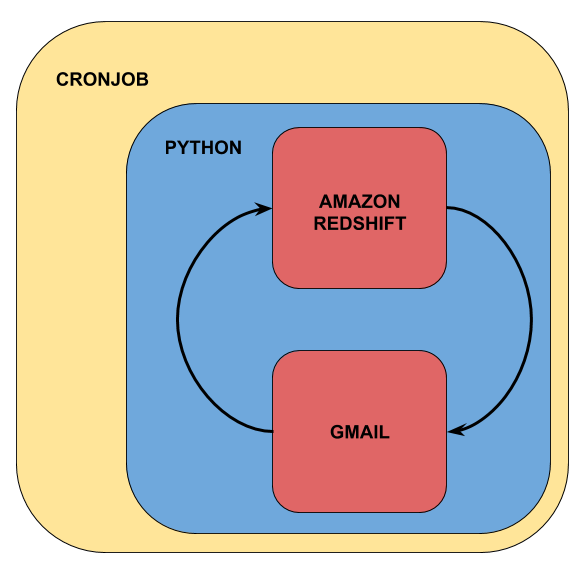
In words, it is four steps in a line:
- cron (the Unix scheduler, set up from the macOS Terminal) wakes up at the times you choose.
- It runs a Python script that holds everything the report needs.
- The script queries Redshift and loads the result into a pandas DataFrame.
- It renders the DataFrame as an HTML table and emails it through Gmail’s SMTP server.
Step 1: query Redshift and load the data
Redshift speaks the PostgreSQL wire protocol, so psycopg2, the standard PostgreSQL driver, can connect to it. Redshift listens on port 5439 by default.
The 2018 version hard-coded the database name, host, user and password in the script. Do not do that. Put them in environment variables (or, better, a secrets manager) and read them at run time. Every value below is a placeholder.
import os

import pandas as pd
import psycopg2

query = "select * from mytable"

connection = psycopg2.connect(
    dbname=os.environ["REDSHIFT_DB"],
    host=os.environ["REDSHIFT_HOST"],      # e.g. example-cluster.xxxx.region.redshift.amazonaws.com
    port=os.environ.get("REDSHIFT_PORT", "5439"),
    user=os.environ["REDSHIFT_USER"],
    password=os.environ["REDSHIFT_PASSWORD"],
)

try:
    with connection.cursor() as cursor:
        cursor.execute(query)
        columns = [col[0] for col in cursor.description]
        data = pd.DataFrame(cursor.fetchall(), columns=columns)
finally:
    connection.close()
mytable stands in for whatever table feeds your report. After this runs, data holds the result as a DataFrame.
Two fixes over the original. First, it now keeps the column names from cursor.description; the 2018 code built the DataFrame from the raw rows, so the columns came out numbered 0, 1, 2. Second, the connection is closed in a finally block. The original wrote cursor.close without parentheses, which does nothing. Closing the connection matters because idle connections hold resources on the cluster.
You can find the host, port and database name in the cluster’s details in the Redshift section of the AWS console.
Step 2: turn the DataFrame into an HTML table
An email can carry HTML, so the simplest way to show a table is to render the DataFrame as HTML. pandas does this through its Styler, which also lets you add CSS.
styled = (
    data.style
    .set_table_attributes('style="border-collapse: collapse"')
    .set_table_styles([
        {"selector": "td, th", "props": [("border", "1px solid black"), ("padding", "4px 8px")]},
    ])
)

table_html = styled.to_html()
In 2018 the method was .render(). It has since been removed in favour of .to_html(). The output is a fragment of HTML (a <style> block and a <table>), not a full page, which is exactly what you want to drop into an email body. If you know a little CSS, set_table_attributes and set_table_styles let you style the table however you like.
If you do not need styling, data.to_html(index=False) is even simpler.
Step 3: build the email and send it
Python’s standard library has everything needed to send mail: smtplib for the connection and the email package to build the message.
The original post said this step used the Gmail API. It did not. It used plain SMTP against smtp.gmail.com on port 587, with the account password typed into the script. Gmail no longer accepts an ordinary account password from a script. You need an app password (which requires two-step verification on the account) or OAuth. Either way, keep it out of the code.
import datetime
import os
import smtplib
from email.message import EmailMessage

today = datetime.date.today().strftime("%a %b %d")

from_address = os.environ["REPORT_FROM"]                  # e.g. reports@example.com
to_addresses = os.environ["REPORT_TO"].split(",")         # e.g. me@example.com,team@example.com

html = f"""\
<html>
  <body>
    <p>Here is today's report.</p>
    {table_html}
  </body>
</html>
"""

message = EmailMessage()
message["From"] = from_address
message["To"] = ", ".join(to_addresses)
message["Subject"] = f"My Report - {today}"
message.set_content("This report needs an HTML-capable mail client.")
message.add_alternative(html, subtype="html")

with smtplib.SMTP("smtp.gmail.com", 587) as server:
    server.starttls()
    server.login(from_address, os.environ["SMTP_APP_PASSWORD"])
    server.send_message(message)
A few things worth keeping from the original:
- Send it to yourself first. While testing, make the sender and the only recipient your own address. You see exactly what your readers will see.
- Put the date in the subject. It makes each day’s report easy to find and easy to tell apart in an inbox.
- The recipients are a list. Adding someone to the report is one more address in
REPORT_TO.
The 2018 code also had two bugs that would have stopped it running. It mixed up fromaddress and fromaddr, and the line meant to wrap the table in HTML (html = 'data_html' % data_html) had lost its template, so it would have raised an error. The f-string above does what that line was meant to do. I have also switched from MIMEMultipart to EmailMessage, the simpler API the standard library recommends now, and added a plain-text fallback.
Run the script by hand and the email lands in your inbox with the date in the subject and the table in the body.
Step 4: one script, scheduled with cron
Once each part works, put them in a single file. I called mine myscript.py.
#!/usr/bin/env python3
"""Daily report: query Redshift, email the result as an HTML table."""

import datetime
import os
import smtplib
from email.message import EmailMessage

import pandas as pd
import psycopg2


def fetch_report_data(query: str) -> pd.DataFrame:
    connection = psycopg2.connect(
        dbname=os.environ["REDSHIFT_DB"],
        host=os.environ["REDSHIFT_HOST"],
        port=os.environ.get("REDSHIFT_PORT", "5439"),
        user=os.environ["REDSHIFT_USER"],
        password=os.environ["REDSHIFT_PASSWORD"],
    )
    try:
        with connection.cursor() as cursor:
            cursor.execute(query)
            columns = [col[0] for col in cursor.description]
            return pd.DataFrame(cursor.fetchall(), columns=columns)
    finally:
        connection.close()


def to_html_table(data: pd.DataFrame) -> str:
    return (
        data.style
        .set_table_attributes('style="border-collapse: collapse"')
        .set_table_styles([
            {"selector": "td, th", "props": [("border", "1px solid black"), ("padding", "4px 8px")]},
        ])
        .to_html()
    )


def send_report(table_html: str) -> None:
    today = datetime.date.today().strftime("%a %b %d")
    from_address = os.environ["REPORT_FROM"]
    to_addresses = os.environ["REPORT_TO"].split(",")

    message = EmailMessage()
    message["From"] = from_address
    message["To"] = ", ".join(to_addresses)
    message["Subject"] = f"My Report - {today}"
    message.set_content("This report needs an HTML-capable mail client.")
    message.add_alternative(
        f"<html><body><p>Here is today's report.</p>{table_html}</body></html>",
        subtype="html",
    )

    with smtplib.SMTP("smtp.gmail.com", 587) as server:
        server.starttls()
        server.login(from_address, os.environ["SMTP_APP_PASSWORD"])
        server.send_message(message)


if __name__ == "__main__":
    data = fetch_report_data("select * from mytable")
    send_report(to_html_table(data))
The first line, the shebang, tells the system which Python interpreter to run the file with. In 2018 I pointed it at my Anaconda install by its full path, which Spyder filled in for me. #!/usr/bin/env python3 picks up whichever Python is first on the PATH. Under cron the PATH is minimal, so if your packages live in a virtual environment or a conda environment, put that interpreter’s full path here instead.
Setting up the cron job
The last part happens in the macOS Terminal. The original post showed this as screenshots. It comes down to two commands.
The first makes the script executable, so the system can run it as if you had:
chmod +x /path/to/myscript.py
The second opens your crontab, the file that lists your scheduled jobs:
crontab -e
Each line in the crontab starts with five fields that set the schedule (minute, hour, day of month, month, day of week), followed by the command to run. This line runs the report at 8:00 every weekday morning:
0 8 * * 1-5 /path/to/myscript.py >> /path/to/myscript.log 2>&1
Redirecting output to a log file is something I did not do in 2018 and should have. When a cron job fails, the log is the only place you will find out why.
cron does not load your shell profile, so the environment variables from your terminal session are not there. Either set them at the top of the crontab, or have the script read them from a file outside the repository that only your user can read.
If the editor that opens is nano, save with ctrl+o, press return to confirm the file name, and exit with ctrl+x. crontab -l lists what is scheduled so you can check it took.
That is the whole pipeline. At the scheduled time cron runs the script, which pulls data from Redshift into a DataFrame, renders it as an HTML table and emails it out.
Looking back from 2026
A laptop is the wrong place for this. cron on a Mac only runs while the Mac is awake, and recent macOS versions may also ask you to grant cron disk access before it can read your files. launchd is the native macOS scheduler and handles sleep better, but the real fix is to move the job off a personal machine. The 2026 version of this is a task in Airflow (or a similar orchestrator), or at least a cron job on a small server or a scheduled container. You get retries, alerting when it fails, and a history of every run.
Credentials come from a secrets manager. Environment variables are the minimum. On AWS the job would read the Redshift and SMTP credentials from Secrets Manager at run time, or better, use IAM authentication to Redshift so there is no long-lived database password at all. Email would go through a service such as Amazon SES rather than a personal Gmail account.
The drivers have moved on a little. AWS now publishes redshift_connector, its own Python driver, though psycopg2 still works. pd.read_sql with a SQLAlchemy engine replaces the cursor and fetchall dance in one line.
The email is often not the right output. Many of these reports are now a scheduled Slack message with the three numbers people care about, or a BI dashboard that is always current. A dashboard lets people filter and drill in. A Slack message gets seen.
But a plain emailed table or CSV still has its place. It arrives without anyone logging in. It works for people outside the company who will never get dashboard access. It leaves a dated record in the inbox of exactly what the numbers were that day, which a live dashboard does not. And when someone wants to do their own analysis, a CSV opens in a spreadsheet with no training. For a small, stable report with a known audience, the 2018 approach, run from a server with proper secrets, is still a reasonable answer.